Homemade Health Monitoring Device for COVID-19
Group Member: Sizhen Ma, Wenzhuo Sun, Zirui Chen, Shuhan Yang
Video Link
Please Watch in Full Screen, Thank you.
Introduction
The homemade health monitoring device for COVID-19 is an equipment that can monitor people’s health. It is measured by the different light transmittances produced by human tissues as blood vessels pulsate. People can use the device at home to measure their oxygen saturation and heart rate. Through the use of this homemade health monitoring device, communities and social organizations such as schools can better monitor the health status of users and thus check the status of patients as early as possible to reduce the spread of COVID-19 and to treat them earlier.
Motivation
With the increasing number of novel Coronavirus infections, nucleic acid testing is becoming more and more important. Most people now go to designated locations in the community for unified testing. This method of testing is inconvenient. Conducting a nucleic acid test is not only expensive but also time-consuming. It usually takes one or two days for people to get results. At the same time, unifying testing in one place increases the risk of people getting infected during testing. To make people safer and faster to get the result, the use of self-testing equipment is a good solution. According to the CDC, most COVID-19 patients have low blood oxygen levels. So our team created a homemade COVID-19 health monitoring device to detect people’s blood oxygen saturation and heart rate to initially determine whether they are infected with the Coronavirus. If the device detects that someone’s blood oxygen concentration or heart rate is different from the normal level, it will upload the data to the community, and the community will contact him for further detection. Finally, to test the accuracy and practicality of the device, our team compare it with Apple Watch, which can detect blood oxygen and heart rate.
Goals
● Measure blood oxygen saturation
● Measure heart rate
● (Based on time) Transfer the data to cloud storage by leveraging IOT
● Compare the measurements of our homemade health monitoring device and Apple Watch
● Send email alerts to people with abnormal data
Progress Report (Last Update 10/14/2021-Progress Report 5)
Methodology
Phenomena of Interest
In this project, we hope to measure oxygen saturation and heart rate as the indicators to see if the user is at risk of COVID-19 or other diseases.
Oxygen Saturation
Oxygen saturation refers to the amount of oxygen flowing through the body with red blood cells. Blood diseases, circulation problems, and lung problems can prevent the body from absorbing or delivering enough oxygen. In this case, blood’s oxygen saturation level is deceased (Deborah Leader, 2021). Therefore, oxygen saturation is useful for detecting multiple abnormal conditions including respiratory infections (e.g. a cold, the flu, COVID-19), chronic obstructive pulmonary disease (COPD), asthma, heart disease, etc.
During a pandemic, an oxygen pandemic seems more useful. Research has shown that some people with COVID-19 have dangerously low levels of oxygen. Dr. Bime, a critical care medicine specialist with a focus in pulmonology at Banner - University Medical Center Tucson, suggested that If you’ve been exposed to COVID-19, or you’ve tested positive and develop symptoms, you had better check your oxygen saturation. If it’s low or you notice it’s dropping, contact your healthcare provider (Banner, n.d.).
Oxygen saturation is such an important index of health, not only because it’s obviously influenced by the abnormal body conditions, but also due to the easy way to measure. Oxygen saturation is usually measured one of two ways: arterial blood gas test (ABG or SaO2) and pulse oximetry (SpO2) (Deborah Leader, 2021). Usually, we use SpO2 to describe the oxygen saturation, which reflects the percentage of oxygen found in arterial blood. A sensor is used to read the wavelengths reflected from the blood, performing on your finger, earlobe, or another place on the body.¬ The normal values of oxygen saturation are generally of 95% to 100%. Once the values are under 90%, people will quickly encounter a serious deterioration in status, and values under 70% are even life-threatening (Cameron, 2007). In this project, we took SpO2 = 90% as a standard. If the oxygen saturation is less than 90%, we assume that he/she may be infected with COVID-19.
Heart Rate
As clarified by Beckerman (2021), “Your heart rate, or pulse, is the number of times your heart beats in one minute. Heart rates vary from person to person. It’s lower when you’re at rest and higher when you exercise.” Usually, it can be affected by multiple factors such as weather, emotions, body size, diseases, medications, caffeine and nicotine, etc. “We’re seeing a lot of patients with symptoms of palpitations or an increase in heart rate with minimal activity, where prior to COVID, they weren’t having any of these symptoms,” says Riple Hansalia, M.D., a cardiac electrophysiologist at Jersey Shore University Medical Center. “That’s been pretty common in our practice, nationally and worldwide.” (Hansalia , 2021) Therefore, we can use heart rate as a supplement health index to detect COVID-19.
Beckerman (2021) also stated that “A normal resting heart rate is usually between 60 and 100 beats per minute (bpm). Your number may vary. Children tend to have higher resting heart rates than adults.” In this project, if the heart rate measured is continuously higher than 100 bpm, together with the abnormal oxygen saturation, we will tell the user that he/she is at risk of COVID-19 and had better take a COVID-19 test; if the heart rate is too low, for example lower than 60 bpm, the user will be informed of the danger of disease, but not COVID-19.
Sensor(s) Used
The only one sensor used in this project is MAX30102 heart rate sensor, which can be used to measure both oxygen saturation and heart rate.
MAX30102
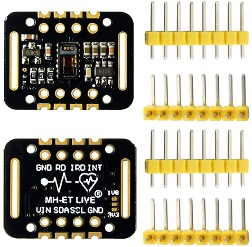
Figure 1 MAX30102 heart rate sensor
● Heart-Rate Monitor and Pulse Oximeter Sensor in LED Reflective Solution
● Tiny 5.6mm x 3.3mm x 1.55mm 14-Pin Optical Module
- Integrated Cover Glass for Optimal, Robust Performance
● Ultra-Low Power Operation for Mobile Devices
-
Programmable Sample Rate and LED Current for Power Savings
-
Low-Power Heart-Rate Monitor (< 1mW)
-
Ultra-Low Shutdown Current (0.7μA, typ)
● Fast Data Output Capability
- High Sample Rates
● Robust Motion Artifact Resilience
- High SNR
● -40°C to +85°C Operating Temperature Range
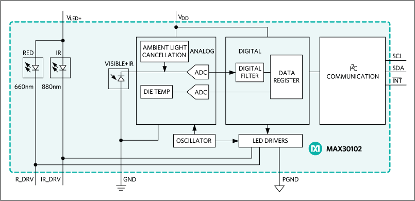
Figure 2 System diagram of MAX30102
Figure 2 is the system diagram of MAX30102 published by Maxim integrated (n.d.), which shows that the chip can be divided into two parts. One is the analog signal acquisition circuit, which emits light of a specific wavelength through RED and IR lamps to collect the light reflected back from the human body. The optical signal is converted into electrical signal through PD tube, and finally converted into digital signal through 18-bit ADC converter. The second part is the digital processing circuit, which filters the original data converted by ADC and places it in the buffer. The MCU reads and writes the internal registers of the chip through the IIC interface and reads and takes out the corresponding data.
The MAX30102 module applies to photoelectric volume method to measure heart rate and oxygen saturation. The basic principle of photoelectric volume method is to measure pulse and oxygen saturation by using the different light transmission rate caused by human tissues when blood vessels pulsate. The sensor, which consists of a light source and an optical converter, are attached to the patient’s finger, wrist or earlobe with straps or clips. The light source is usually led with specific wavelength (red light near 660nm and infrared light near 900nm), which is selective for oxygenated hemoglobin (HbO2) and deoxygenated hemoglobin (Hb) in arterial blood. When the light beam passes through the peripheral blood of the human body, the transmittance of the light changes due to the change of the volume of arterial pulsation congestion. At this time, the photoelectric converter receives the light reflected by the human body tissue, converts it into electrical signal, and amplifies and outputs it. As the pulse is a signal that changes periodically with the beating of the heart, and the volume of the arterial vessels also changes periodically, the change period of the electrical signal of the photoelectric converter is the pulse rate. Meanwhile, according to the definition of blood oxygen saturation, it can be expressed as:

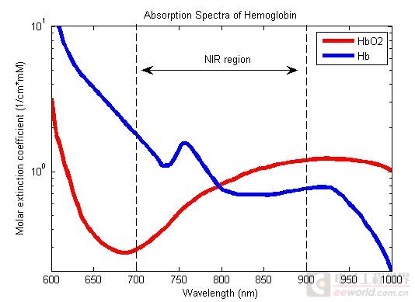
Figure 3 Absorption of oxygenated hemoglobin (HbO2) and deoxygenated hemoglobin (Hb) at different wavelengths
The MAX30102 consists of a complete LED and drive part, light sensing and AD conversion part, ambient light interference elimination and digital filtering part, leaving only the digital interface to the user, greatly reducing the user’s design burden. The user only needs to read THE FIFO of MAX30102 through hardware I2C or analog I2C interface with the MCU, and then the converted light intensity value can be obtained. The heart rate value and blood oxygen saturation can be obtained by writing the corresponding algorithm.
Signal Conditioning and Processing
Firstly, we set up the heart rate sensor MAX30102 to make sure if it could work as expected. As it is the only sensor used in this project, we directly connected the sensor to the RPi on the breadboard as shown in Figure 4. Only four pins were used, connecting to VCC 5V, SDA, SCL and GND, so that the sensor could get powered and send the data to our RPi. When we start sensing, we can simply put our finger onto the sensor, as shown in Figure 5.
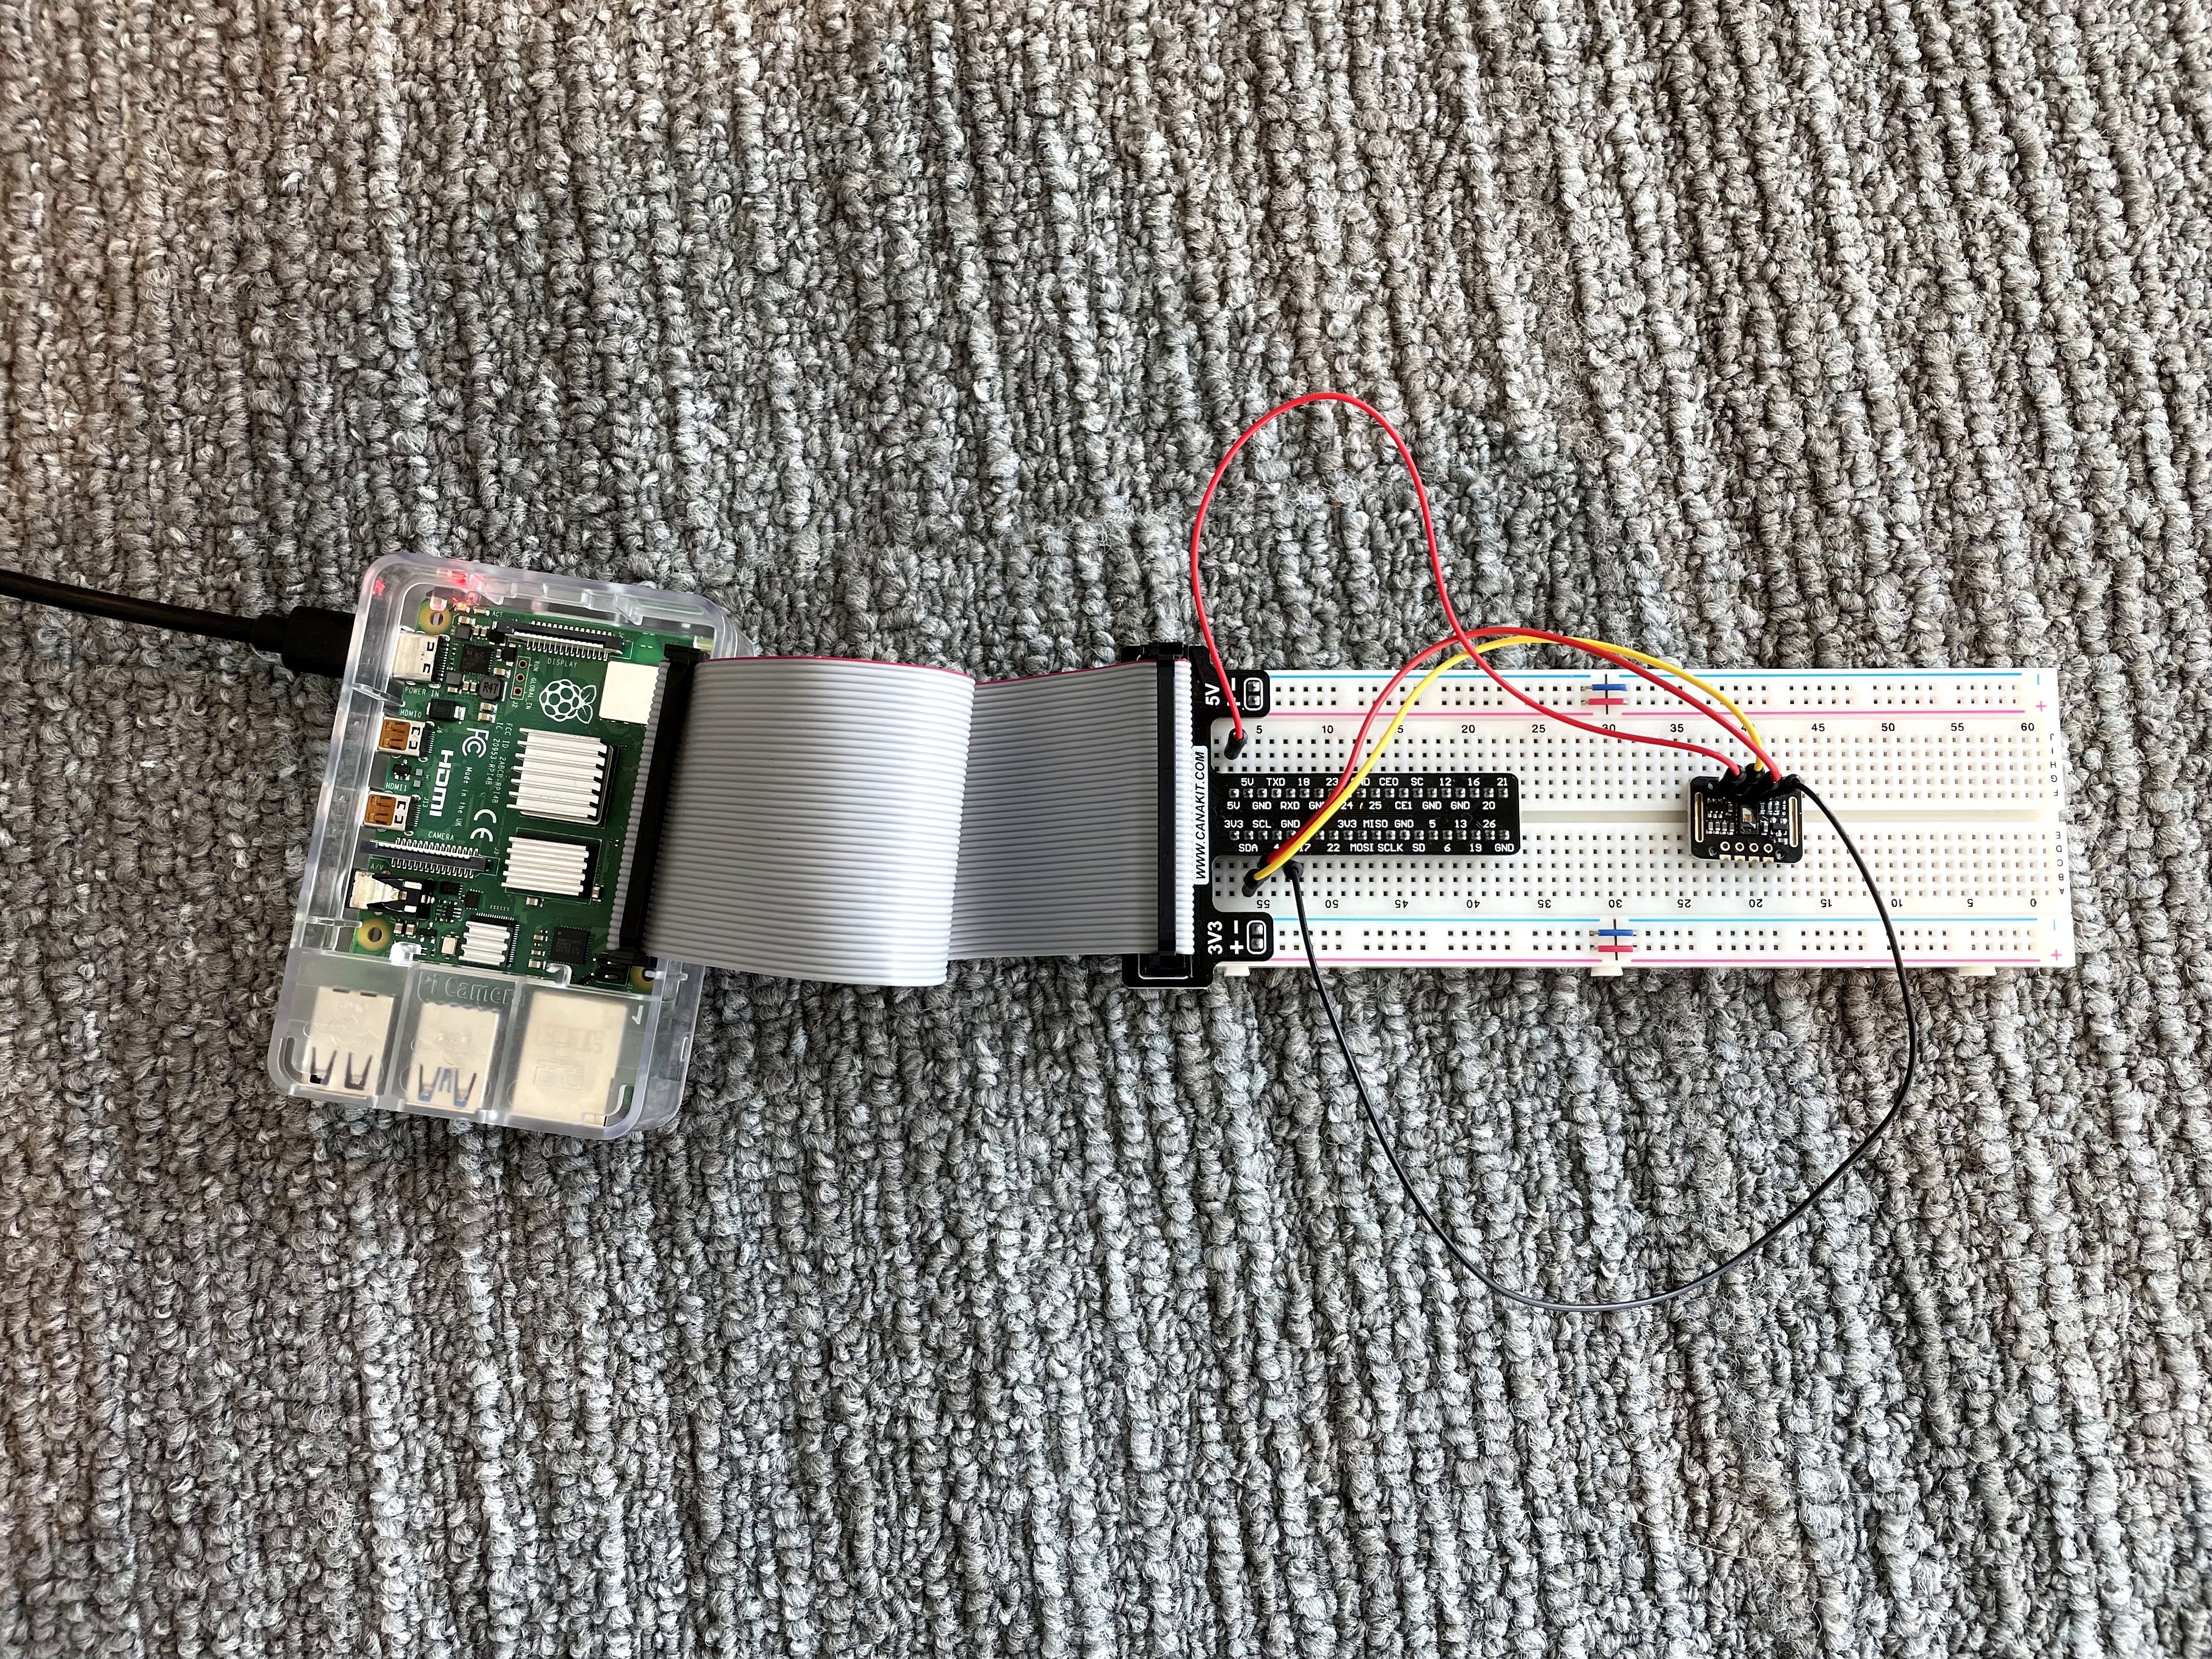
Figure 4 Circuit for MAX30102 sensor

Figure 5 Sensing with a finger
Then, we coded to have the sensor collect data. Based on the instructions provided by Maxim Integrated, applying to max30102 library, we developed our own codes to calculate and output the sensed values in the terminal at a sampling frequency of 100 Hz. If no finger is detected, a message of “Finger not detected” will show up in the terminal and the default values of heart rate and oxygen saturation are 0 and -999, which indicate unsuccessful data collection. If the data is successfully detected, every pair of values detected will be printed out as shown in Figure 6.
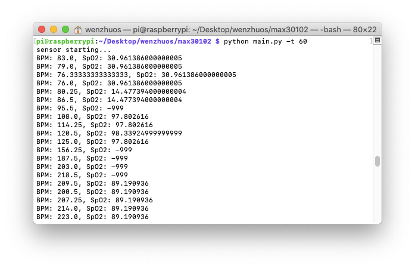
Figure 6 Outputs of sensed data in the terminal
In default, the sensing process lasts for 30 seconds, but it can run for any time as told in the command line with “-t”. In general, to better detect the heart rate and oxygen saturation, we ran the sensor for 60 seconds in the following tests.
In experiments, we found that the detected values are quite unstable, so that it’s hard to judge if the indices are in the normal range. Therefore, we decided to calculate the average values in the sensing period and take them as the results. We then extended the self-designed class for max30102 to store all the data collected and compute for average before stopping the sensor. As the default values are 0 and -999, they will largely influence the average values. That’s why we excluded the extreme values (SpO2 lower than 80) before calculating the average. The averages will also be printed out in the terminal before sensor stops. Figure 7 shows the terminal interface at the end of the sensing process.
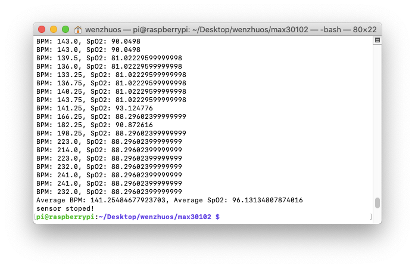
Figure 7 Outputs of averaged sensed data in the terminal
Furthermore, if the average both the heart rate and oxygen saturation are out of the normal range (bpm in the range of (60, 100) and SpO2 in the range of (90, 100)), additional message “Danger!” will also show up in the terminal to warn the users.
Experiments and Results
1. MAX30102 and IOT
After successfully obtaining the data sensed in the terminal, we hope to display the results in a more user-friendly way. Therefore, we turned to the Adafruit IO platform to create a dashboard showing the sensed heart rate and oxygen saturation in real time.
To achieve this goal, we further modified the codes, connecting to our Adafruit account when starting the sensor and sending the data to the IoT device every time the data is collected and output to the terminal, at a sampling frequency of 100Hz.
However, there is a problem that the frequency is too high for the IoT device to accept the data. That is, the data rate limit is easily reached, and it’ll stop the program and take some time to reset. In order to solve this problem, we firstly tried to simply decrease the sampling frequency. It surely worked, but as the data rate limit is quire low, it only worked when we lower the sampling frequency to nearly 1 Hz. In this case, the sampling frequency is too low to obtain accurate values. This phenomenon can be explained by Nyquist-Shannon sampling theorem. When we run the sensor every 1 second to satisfy the data rate limit of IoT device, the sampling frequency of 1 Hz is far lower than twice the exact signal frequency, so that we failed to get the accurate values. Faced with the difference of frequency requirements for sampling and uploading to the IoT device, we had to respectively run the sensor and publish the data on IoT device at different frequencies. In the end, we made it by having the sensor collect data every 0.03 second but upload the data to Adafruit IO platform every 0.90 second (sending 1 pair of values after collecting 30 pairs).
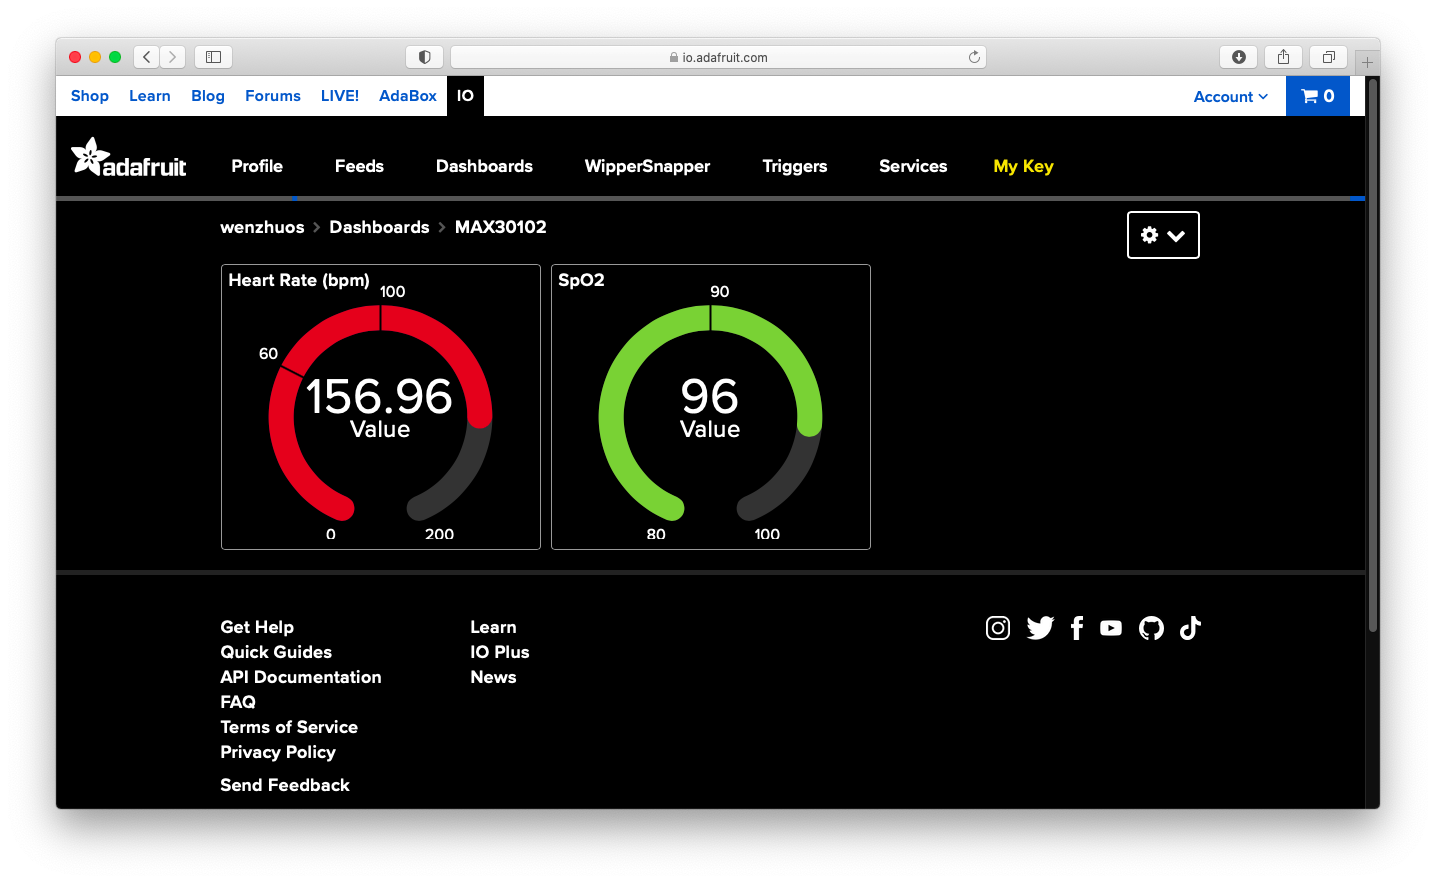
Figure 8 Dashboard Interface
Figure 8 shows how the data is displayed on the Adafruit IO platform. There are two feeds, respectively taking the heart rate and oxygen saturation. The block on the left shows the real-time heart rate in bpm. If the value is over 100 or lower than 60, the gauge block will warn in red. Similarly, the other gauge block is for oxygen saturation (SpO2), warning when the value is lower than 90. After the sensing process stops at the given time, the last pair of values uploaded to the IoT device is the average heart rate and oxygen saturation in the period. That is, users can directly read their average health indices by looking at the final values appearing in the dashboard.
2. Comparison on measurements between Apple Watch Series 6 and MAX30102
In this part, comparison will be presented on the ability (i.e. accuracy, fluctuation) of measurements over heart rate (BPM) and oxygen saturation (SpO2) using two devices. Before presenting the results, first we will show how the experiments is presented.
In the experiment, one variable is tested each time. This is due to the interface of apple watch only allows user to measure one variable at a time (i.e. BPM or SpO2). In order to control the variability and uncertainty in each experiment, the test is going to be present simultaneously to one person in the group:
The measurements of apple watch will be documented manually due to the easy accessibility (i.e. barely looking) and relative slow reaction speed (It takes 15 seconds for Apple Watch to return a SpO2 reading). The measurements of MAX30102 will be documented by Adafruit IO platforms.
These frequency differences between two devices lead us to another question on the evaluation process. It is not possible to compare the raw data. Every data we gather from Apple Watch, approximately 150 data points for MAX30102 will be gathered at the same time. We use the following two ways to keep data from two devices on the same pace:
(1) Send a data point of MAX30102 to Adafruit IO every 3 seconds. Read a measurement from Apple Watch every 15 seconds. Compares the average of 5 data points send to Adfruit IO with Apple Watch Reading(Group 1-9).
(2) Send the average (due to the receive restriction of Adafruit IO) of the past 150 data points (when we use a sampling frequency of 10 Hz, 15 seconds means 150 data points) to Adafruit IO every 15 seconds. Read a measurement from Apple Watch every 15 seconds (Group 10-18). Each group has 10 data points (10 times consecutive 15 seconds of measurement for each group).
Same procedure is done with the BPM data though the interval changes from 3 to 5 seconds instead of 15 seconds (Unlike SpO2, BPM on Apple Watch changes with real time) as that is approximately the interval between apple watch shows fluctuations in readings.
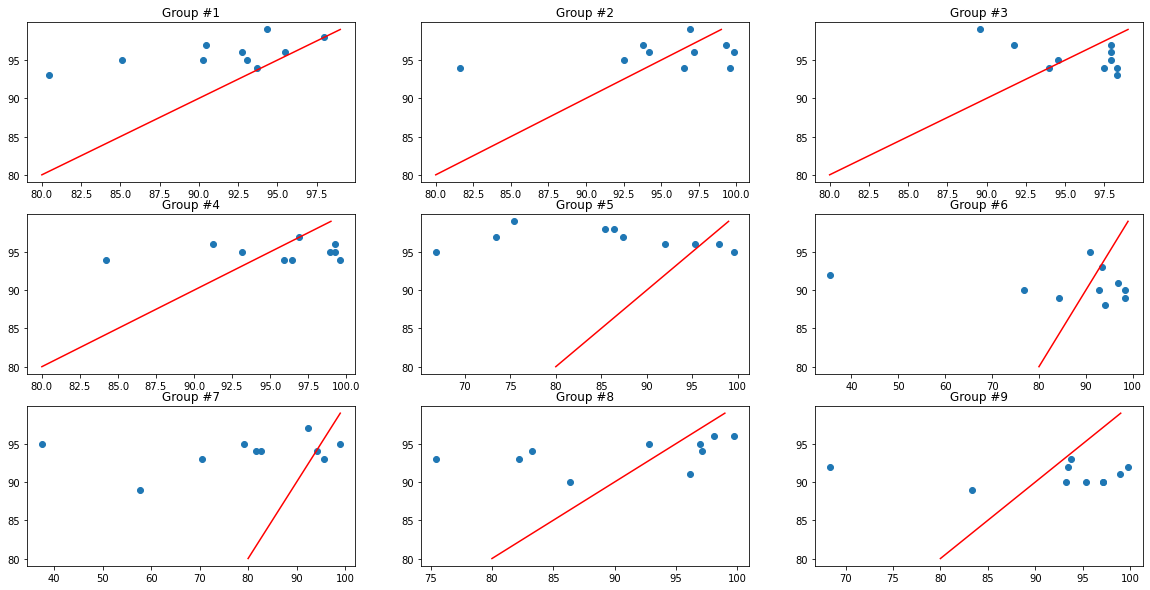
In the comparison, we used SpO2 data and we first showed the data in a scatter plot where x-axis stands for the measurement of MAX30102 and y-axis stands for the measurement of Apple Watch in Figure 10. The red line in each subplots stands for y=x.
| Group 1-9 | Group 10-18 |
|---|---|
 |
 |
Figure 10 Comparison of SpO2 sensed by MAX30102 and Apple Watch
With the help of these graphs, one could easily see that with the help of a wider averaging window, the data points stay closer towards the baseline (red line which means two devices returns the same measurements at the same time). Although the principle it uses is not exactly Simple Moving Average (SMA), the outcome is close, which is smoothen the signal and filtered those data points that are out of the ordinary. To be more specific, combining the practical situations, it acts like a high-pass filter without a settled cutoff frequency.
Same kind of difference can be found if data points from two devices of same group are plotted separately. The Pearson correlation coefficient can be found at the top of each subplot in Figure 11 (PLEASE RIGHT CLICK THE GRAPH AND OPEN IT IN A NEW TAB FOR A BETTER VIEWING EXPERIENCE).
| Group 1-9 | Group 10-18 |
|---|---|
 |
 |
| blue:MAX30102 orange:Apple Watch | blue:MAX30102 orange:Apple Watch |
Figure 11 The Pearson correlation coefficient of SpO2 sensed by MAX30102 and Apple Watch
So, for further comparison we will use data from group 10 to group 18. Table 1 and Table 2 respectively show the mean value and variance comparison of the data collected by MAX30102 and Apple Watch.
Table 1 Mean comparison
| Mean | #10 | #11 | #12 | #13 | #14 | #15 | #16 | #17 | #18 |
|---|---|---|---|---|---|---|---|---|---|
| Watch | 96.80 | 94.20 | 96.50 | 97.70 | 93.90 | 97.00 | 98.40 | 95.10 | 93.70 |
| MAX30102 | 97.05 | 93.20 | 95.61 | 98.44 | 93.37 | 96.42 | 98.01 | 96.09 | 99.48 |
| Error[%] | 0.26 | 1.06 | 0.92 | 0.76 | 0.57 | 0.59 | 0.40 | 1.04 | 6.17 |
Table 2 Variance comparision
| Mean | #10 | #11 | #12 | #13 | #14 | #15 | #16 | #17 | #18 |
|---|---|---|---|---|---|---|---|---|---|
| Watch | 2.36 | 0.56 | 1.45 | 1.01 | 0.69 | 2.20 | 0.44 | 2.89 | 4.21 |
| MAX30102 | 2.60 | 2.66 | 15.50 | 2.23 | 5.85 | 16.09 | 4.27 | 4.49 | 0.17 |
Since we currently don’t have ways to obtain the “true labels”, we used Apple Watch’s measurements as our true label. It turns out, apart from group 18, all other groups lie within an error of 1.1% on the mean value. However, such pattern doesn’t mean Vanilla MAX30102 is comparable in stability towards Apple Watch. This is because the variance difference between two devices in a same group could have huge fluctuations over groups. We tried to change sample rate and averaging window (These two must change simultaneously under our comparison rule) to address this problem, which didn’t give us an answer. After consideration, we brought out a hypothesis:
Compared to Apple Watch and other oximeter on market right now, our device measures the light reflection in an ‘open’ environment. Those devices tend to use model characteristics to ensure interference from environment to be as little as possible (i.e., on market oximeter let users put their fingertips into a hole-shape area to ensure full contact and prevent light leak).
So, we decided to add a cap on the top of our device to see if it would efficiently increase performance. Figure 12 shows how the cap worked on our device.
Figure 12 Closed environment desgined to the device
We did five additional groups of testing, and the comparison is shown in Figure 13 and Table 3.
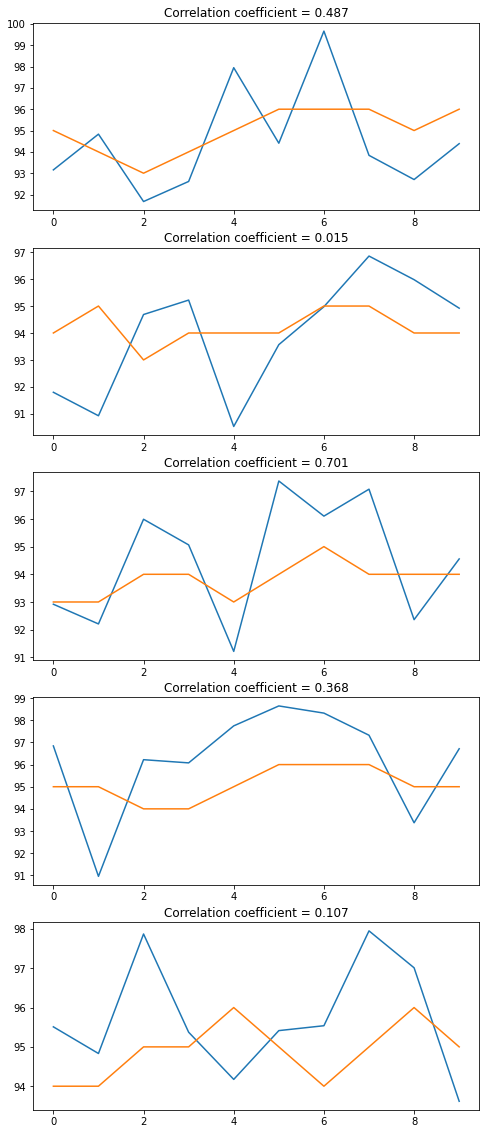
Figure 13 Comparison of SpO2 sensed by MAX30102 in an updated environment and Apple Watch
Table 3 Variance comparision
| Variance | #19 | #20 | #21 | #22 | #23 |
|---|---|---|---|---|---|
| Watch | 1.00 | 0.36 | 0.36 | 0.49 | 0.49 |
| MAX30102 | 5.57 | 4.23 | 4.31 | 5.04 | 1.92 |
After adding a relatively closed environment, the variance of data measured by MAX30102 is still significantly higher than Apple Watch. We haven’t yet found the reason. As for accuracy, we believe MAX30102 could give relatively accurate (less than 2% error) outputs under the right operations.
3. Email Alerts
In this part, we will add email sending alert feature. With the help of IFTTT, email and Adafruit IO is easily connected. The original thought is send an email whenever a single data point is out of the ordinary (email is sent if spo2 < 90). It turns out, even with the receive restriction of Adafruit IO, a 15 second measurement with 10 Hz sampling rate results in multiple email being sent because of the variance we discussed in previous section. Figures 14 show the emails received.
Emails Received | Email Content
:————————-:|:————————-:
 |
|  6 emails were received in one measurements | Each email looks like this
Figure 14 Alert emails received
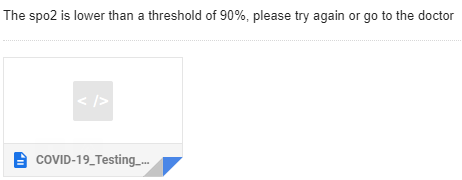
As this is highly inconvenient and inaccurate, instead, we add another feed in Adafruit IO to document the proportion of abnormal data (spo2 < 80) of each 15 seconds measurement window. If this proportion is higher than 0.5, we will send one alert. This ensures at most one alert is sent during each measurement:
| Email Content |
|---|
 |
Figure 15 Updated Alert email
Figure 15 is how the updated alert email is like. The attached link is the tartan test information page.
Code
##The code for calculating spo2 (hrcalc.py) and initializing max30102 (max30102.py) originally comes from vrano714:
##https://github.com/vrano714/max30102-tutorial-raspberrypi
##But with a few modifications so that it won't return ZeroDivisionError

##The code for initializing HeartRateMonitor (heartrate_monitor.py) and main file (main.py) originally comes from doug-burrell:
##https://github.com/doug-burrell/max30102/blob/master/heartrate_monitor.py
##But with a few modifications so that it can be connected to Adafruit IO and Gmail

##The original code is written to run on Arduino Uno:
##https://github.com/MaximIntegratedRefDesTeam/RD117_ARDUINO/

import max30102
import hrcalc
import time
import numpy as np
from Adafruit_IO import *

m = max30102.MAX30102()
IO_USERNAME = "Your Username"
IO_KEY = "Your Key"
bpm_key = "max30102_bpm"
spo2_key = "max30102_spo2"
threshold_key = "max30102_threshold"


class HeartRateMonitor(object):

    LOOP_TIME = 0.03

    def __init__(self, print_raw=False, print_result=False):
        self.bpm = 0
        if print_raw is True:
            print('IR, Red')
        self.print_raw = print_raw
        self.print_result = print_result
        self.rec_bpm = []
        self.rec_spo2 = []
        self.avg_bpm = 0
        self.avg_spo2 = 0

    def run_sensor(self):
        sensor = MAX30102()
        ir_data = []
        red_data = []
        bpms = []
        aio = Client(IO_USERNAME, IO_KEY)
        i = 0
        abn = 0

        # run until told to stop
        while not self._thread.stopped:
            # check if any data is available
            num_bytes = sensor.get_data_present()
            i += 1
            if num_bytes > 0:
                # grab all the data and stash it into arrays
                while num_bytes > 0:
                    red, ir = sensor.read_fifo()
                    num_bytes -= 1
                    ir_data.append(ir)
                    red_data.append(red)
                    if self.print_raw:
                        print("{0}, {1}".format(ir, red))

                while len(ir_data) > 100:
                    ir_data.pop(0)
                    red_data.pop(0)

                if len(ir_data) == 100:
                    bpm, valid_bpm, spo2, valid_spo2 = hrcalc.calc_hr_and_spo2(ir_data, red_data)
                    if valid_bpm:
                        bpms.append(bpm)
                        while len(bpms) > 4:
                            bpms.pop(0)
                        self.bpm = np.mean(bpms)
                        if (np.mean(ir_data) < 50000 and np.mean(red_data) < 50000):
                            self.bpm = 0
                            if self.print_result:
                                print("Finger not detected")
                        if self.print_result:
                            self.rec_bpm.append(self.bpm)
                            if spo2 >= 80:
                                self.rec_spo2.append(spo2)
                            else:
                                abn += 1
                            print("BPM: {0}, SpO2: {1}".format(self.bpm, spo2))
                            if i % 30 == 0:
                                aio.send(bpm_key, self.bpm)
                                aio.send(spo2_key, spo2)


            time.sleep(self.LOOP_TIME)

        aio.send(threshold_key, abn/i)
        sensor.shutdown()

    def start_sensor(self):
        self._thread = threading.Thread(target=self.run_sensor)
        self._thread.stopped = False
        self._thread.start()

    def stop_sensor(self, timeout=2.0):
        self._thread.stopped = True
        self.bpm = 0
        self._thread.join(timeout)
        print("Average BPM:{0}, Average SpO2:{1}".format(self.avg_bpm, self.avg_spo2))
        if self.avg_spo2<90 and (self.avg_bpm <60 or self.avg_bpm>100):
            print("DANGER!!")
        aio.send(bpm_key, self.avg_bpm)
        aio.send(spo2_key, self.avg_spo2)
        self.bpm = 0
        self.rec_bpm = []
        self.rec_spo2 = []
        self.avg_bpm = 0
        self.avg_spo2 = 0
        self._thread.join(timeout)
Discussion
In this project, our goal is to create a supplementary means for COVID-19 testing. In this way, we tested the user’s heart rate and blood oxygen levels with the MAX30102 sensor in this project. Then, to verify the accuracy of our data, we compare it to authoritative sensors like Apple Watch Series 6. We designed the circuit on the Raspberry Pi to let the sensor work and, by leveraging Adafruit IO, we can analyze data in a more sourceful manner. Finally, an email connection would make between Adafruit IO and Gmail via IFTTT, which sends an email to the user to alert them of any abnormalities in their oxygen saturarion level.
Due to the limitations of the sensors and our coding capabilities, our system still has some flaws. For example, our measured heart rate values were inaccurate, and the resting heart rate did not stay between 60bpm and 100bpm. At the same time, the fluctuations within the measurement of oxygen saturation still persists.
In the future, we believe that there is room for improvement in our detection system as follows. First, we could equip this system with an LCD. In this case, users can more easily know their body condition and various data such as measurement time. Secondly, we can use python crawler to crawl user data and automatically help users to fill in related tests online. Finally, the problem of inaccurate heart rate monitoring may be caused by hardware problems such as resistance; we find that there exists a few examples of re-designing MAX30102 online.
Data and code used to recreate the analysis can be find in our Github Repo Link
References
[1] Deborah Leader, R. N. (2021, July 22). The importance of O2 sats with COPD. Verywell Health. Retrieved October 5, 2021, from https://www.verywellhealth.com/oxygen-saturation-914796.
[2] What you need to know about your blood oxygen level. Banner. (n.d.). Retrieved October 5, 2021, from https://www.bannerhealth.com/healthcareblog/teach-me/blood-oxygen-level-what-you-need-to-know.
[3] Cameron, M. H., & Monroe, L. G. (2007). Chapter 22 - Vital Signs. In Physical rehabilitation: Evidence-based examination, evaluation, and intervention. essay, Saunders/Elsevier.
[4] Beckerman, J. (2021, August 18). Heart rate: Normal pulse, Measurement, Max and target heart rate . WebMD. Retrieved October 5, 2021, from https://www.webmd.com/heart-disease/heart-failure/watching-rate-monitor.
[5] Hansalia, R. (2021, August 18). Does covid-19 cause heart rate issues? Hackensack Meridian Health. Retrieved October 5, 2021, from https://www.hackensackmeridianhealth.org/HealthU/2021/08/18/does-covid-19-cause-heart-rate-issues/.
[6] Maxim integrated. (n.d.). MAX30102 High-Sensitivity Pulse Oximeter and Heart-Rate Biosensor for Fitness & Healthcare. Maxim integrated - Analog Devices. Retrieved October 5, 2021, from https://www.maximintegrated.com/en/products/interface/sensor-interface/MAX30102.html.
[7] anning865 (2017). MAX30102 initial use and heart rate, blood oxygen measurement principle. Retrieved October 5, 2021, from http://home.eeworld.com.cn/my/space-uid-363835-blogid-589641.html